The bioeconomy is a complex system, and how to choose the right technology to produce a desired product can be bewildering at times. Do the economics of the process make sense? Are there better options? Even if I choose the most cost effective process to produce my product of interest, will I be able to effectively source inputs, or will competing markets undercut me? A technology might make sense in current market conditions, but will it make sense in the future?
In thinking about how to produce any given bio-based product, I find it useful to consider what I call the four dimensions of the bioeconomy. This blog explains this framework, and provides some insights into the what tools and craft can be useful in assessing each of the dimensions, with an aim to making wise investment decisions in sourcing biobased technologies.
Dimension 1: The pathway
The first dimension is the straight line of the overall process from input, through intermediates, to final product. To an engineer, this would be represented as a process-flow diagram, as follows:
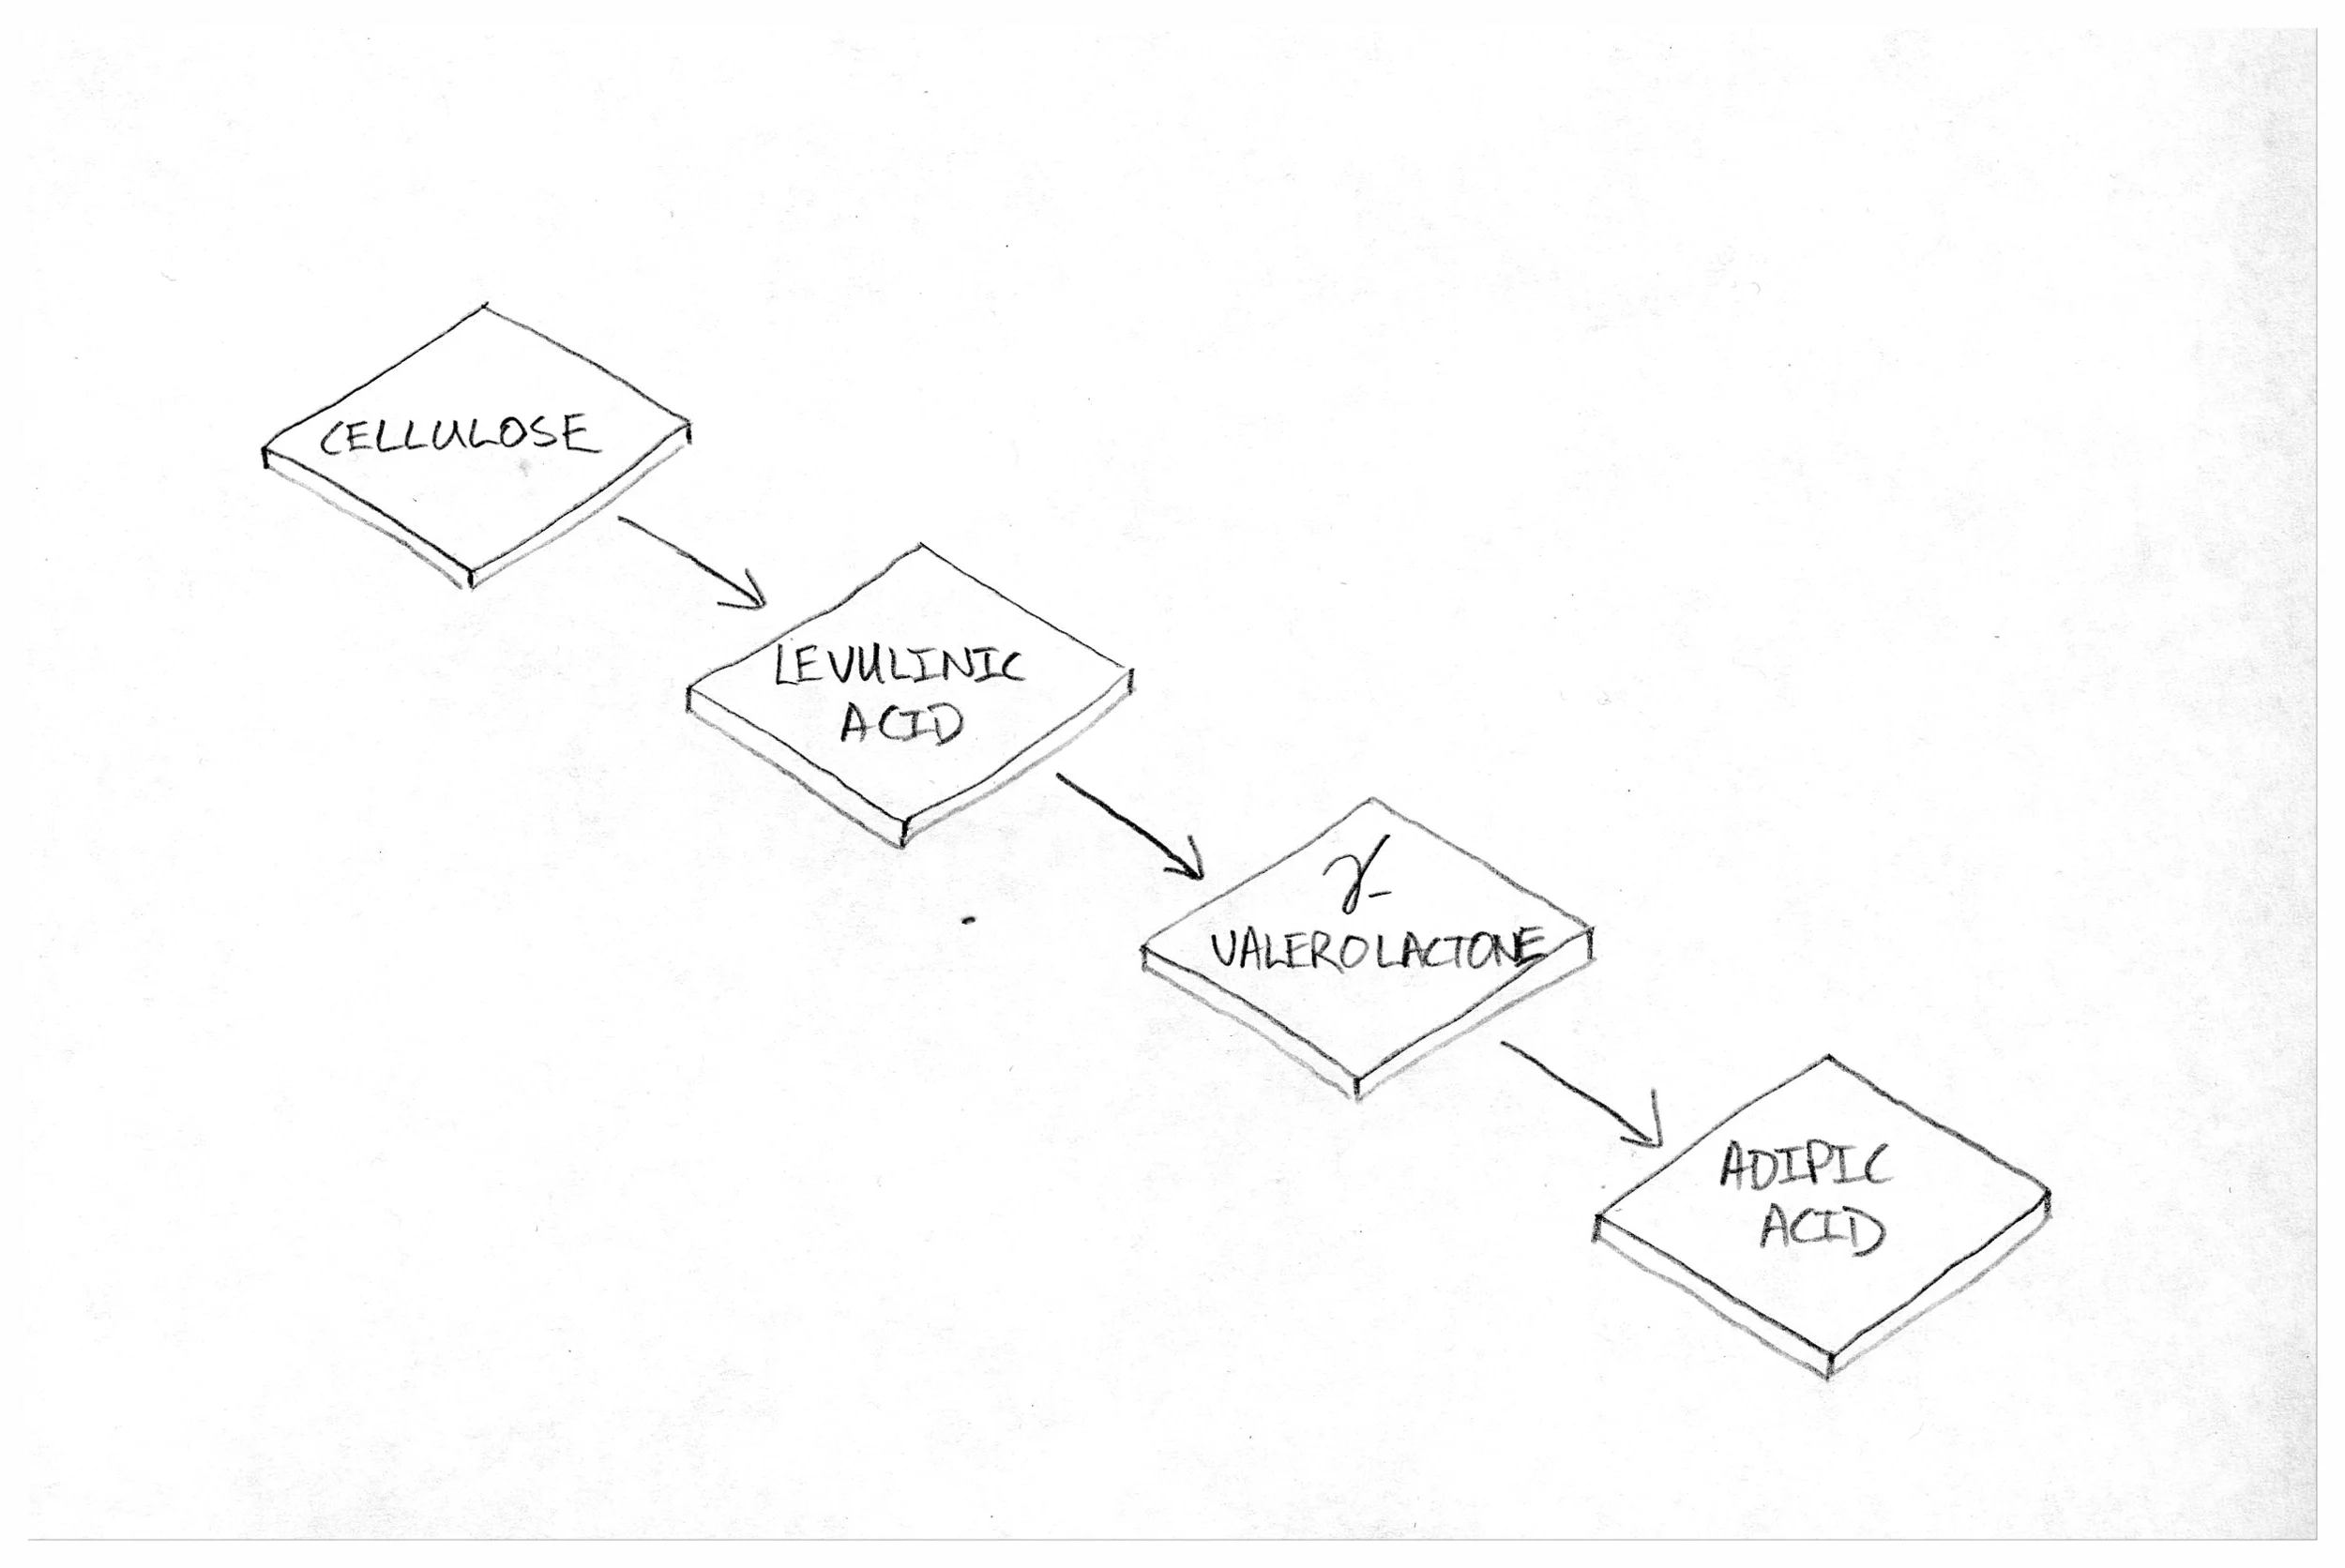
Figure 1: The Pathway. Essentially, a simple process flow diagram showing feedstocks, transformations to intermediates, and final product.
In this example, cellulose is transformed in three steps to adipic acid, a bioplastics precursor. If you want to make a biobased adipic acid, this is one of the options. The existence of this option indicates that it is technically feasible to make these conversions and generate this product. But is it affordable? A technoeconomic analysis (TEA) is the tool to answer that question, yielding a cost of production that can be used to assess the competitiveness of this pathway against the incumbent, or other technologies. Oh, and speaking of other technologies...
Dimension 2: the spaghetti diagram
The second dimension if the bioeconomy recognizes that for any given pathway or desired product, there are going to be multiple technology options for producing the target. These are the polarizing diagrams that people often show at conferences; half the audience's eyes glaze over, instantly bored by technology-TMI, while the other half perks up, thrilled to finally get into the nitty gritty.

Figure 2: The Spaghetti Diagram. This dimension of the bioeconomy recognizes the alternative pathways to producing a bioproduct of interest.
In this example, two additional ways to produce adipic acid from cellulose are shown. For clarity's sake, this is a very simple spaghetti diagram - often they are bewilderingly complex, and certainly there are a number of other pathways to produce adipic acid from cellulose or other feedstocks that aren't shown here. Nevertheless, as this diagram shows, there are always going to be alternative technologies to consider.
It is nice to have options, but how can you work out which one to choose? Again, TEA is going to be the tool that allows you to compare the relative performance of the options. But beware, don’t just compare the final output cost of production: the big challenge in this situation is that for TEAs to be comparable between different competing pathways, they need to be carried out using the same methodology and assumptions. Unfortunately, there are as many different ways to do a TEA as there are to produce a bioplastic, and so it's uncommon to be able to just go to the literature and find perfectly comparable TEAs for parallel pathways. Looking closely at the methodologies and assumptions used is critical to being able to effectively compare the results of different TEAs and use them for making decisions about the relative merits of technology options.
Dimension 3: Different Planes
So far, we've considered the various ways in which a single product, or class of products like bioplastics, can be created. However, one of the best things about the bio-economy is its versatility – an enormous range of commodities and consumer products can be made from renewable resources. But this versatility poses a challenge for those who seek to generate a single product: any given input or intermediate could be used by other processes for producing other products. For example in the diagram below bioplastic intermediate 5-HMF can be converted to a fuel precursor 2,5-DMF. Likewise other intermediates in the original example can also be converted into intermediates or fuel products as shown by the coloring of blue or green in the diagram.

Figure 3: The parallel planes that form the emerge in a third dimension of the bioeconomy. The original bioplastics spaghettit diagram is shown in blue, with a parallel biofuel plane in green, and a nutriceutical plane in red.
And it's not just fuel products that may be competing for intermediates or inputs. There is a range of different sectors of the economy that bio-based products can serve. One simple example shown in this diagram is the production of omega 3 fatty acids from glucose. Here the bioeconomy is contributing to human nutrition and health by the generation of sustainably-sourced essential oils. Thus, there are many layers to the bioeconomy and these different classes of market (bioplastic pathways shown in blue, biofuel pathways in green, nutraceuticals show in red) fit into the dimensional framework as parallel planes. This three-dimensional structure expands the spaghetti diagram across markets as a set of overlapping and reticulated pathways.
The complex network here demonstrates the risk of competition. Even if a given pathway chosen carefully from a spaghetti diagram of options pencils out with a promising TEA, if one cannot affordably source input feedstock because other users can pay more for it, the pathway will not be commercially viable. Likewise, if an intermediate in the chosen pathway has greater value being converted to a different product serving a higher value market, then the originally targeted pathway is similarly unviable. This latter situation is not necessarily a problem from the perspective of a project developer who is seeking to maximize returns, but it can certainly disrupt the plans of strategic investors who are interested in specific products or markets.
Given this complexity, how does one understand the competitiveness of a target pathway amongst all of the various permutations and combinations by which carbon may flow through the bioeconomy? The tools required to analyze this question are far more complex and less well understood than simple techno economic analysis. What is needed here is an understanding of the characteristics of the markets for the various inputs, intermediates and products in this three-dimensional framework.
For example, if you are considering glucose as an intermediate in your pathway to produce adipic acid you need to understand not just the input costs of glucose but also the opportunity cost of not turning that glucose into, e.g., omega-3 fatty acids or ethanol. You will need to understand the size, pricing and price elasticity of both omega-3 fatty acid and ethanol markets as well as your target market of adipic acid. Much of this information is available as general market research, although advanced analysis and modeling may be required to understand the interrelation between these markets, such as could be performed through a general equilibrium modeling.
By recognizing that there are is a three-dimensional context to any given pathway of interest you are acknowledging that competition for renewable carbon will be fierce and needs to be understood before making investment decisions in bioeconomy technologies.
Dimension four: Dynamics over Time
By fully considering the previous three dimensions one will understand the relative competitiveness of a pathway across all aspects of the bioeconomy, but only at a given point in time. So far we have essentially a static view. But things change. If the enormous pace of change over the past few years are any indication, the bioeconomy is certainly going to be highly dynamic moving forward. Therefore the fourth and final dimension of the bioeconomy is time, just as it is in the physical world. By acknowledging the time dimension, one is prepared to understand how the competitiveness of a pathway will change over time as the bioeconomy evolves. Factors that might drive change over time include:
Emerging technologies leading to disruption, both internally and externally.
Internal dynamics of the bioeconomy, such as market saturation, cost curve reduction opening the door to competing in new markets, etc
Policy changes over time including increasing carbon regulation or the establishment and or the disestablishment of incentivizing policies.
As an example from the diagram above, the potential adipic acid producer may be concerned about the pathway that routes through glucose as an intermediate because more profitable production of ethanol may divert that glucose to production of fuel ethanol, not adipic acid. But in the near term, there is uncertainty about policy support for ethanol production. Also a growing share of the gasoline market, into which ethanol is a blendstock, is being lost to electrification of light vehicles. These dynamics may suggest that the value of ethanol may drop in the near-to-mid term, and the concerns about the relative competitiveness of adipic acid production from glucose should be lessened.
Unlike the 'lower' dimensions, which can best be understood through an analytical, quantitative methodologies such as TEA, the considerations of this final dimension are less tractable to standard methodologies. Understanding the temporal dynamics of the bioeconomy is really more of a craft than a science. Having a wide range situational awareness across the range of markets, policy drivers, and emerging technologies is the best way to be ready to successfully predict where the bioeconomy is headed. Having a strong network helps too - market intelligence that doesn't reply on public information can provide a competitive headstart for better positioning to take advantage of near-term opportunities.
Summary
This framework helps in developing a better understanding of how a technology fits into the broader context of the bioeconomy. Taking a narrow view of what constitutes 'viability' for a novel technology can lead to wasted time, energy and resources. For those who invest in technology in the bioeconomy, considering all four dimensions will allow you to move from answering the question of "can we do this?" to the more important "should we do this?"
P.S. This is my first blog post on the bioeconomy, and I'd love to hear your feedback. Am I making sense, or am I missing anything important? Are there any topics you'd like me to blog about? Let me know in the comments, or drop me a line (see the contact page). Thanks for reading!